Guided teaching
A lecture can highlight, focus, animate, pause, and restore the visual at the moment each idea is explained.
These examples show how one learning objective can become a guided demonstration and an exploratory activity. Each example includes its current status: live trigonometry, interactive robotics previews, and an anatomy preview in independent educational review.
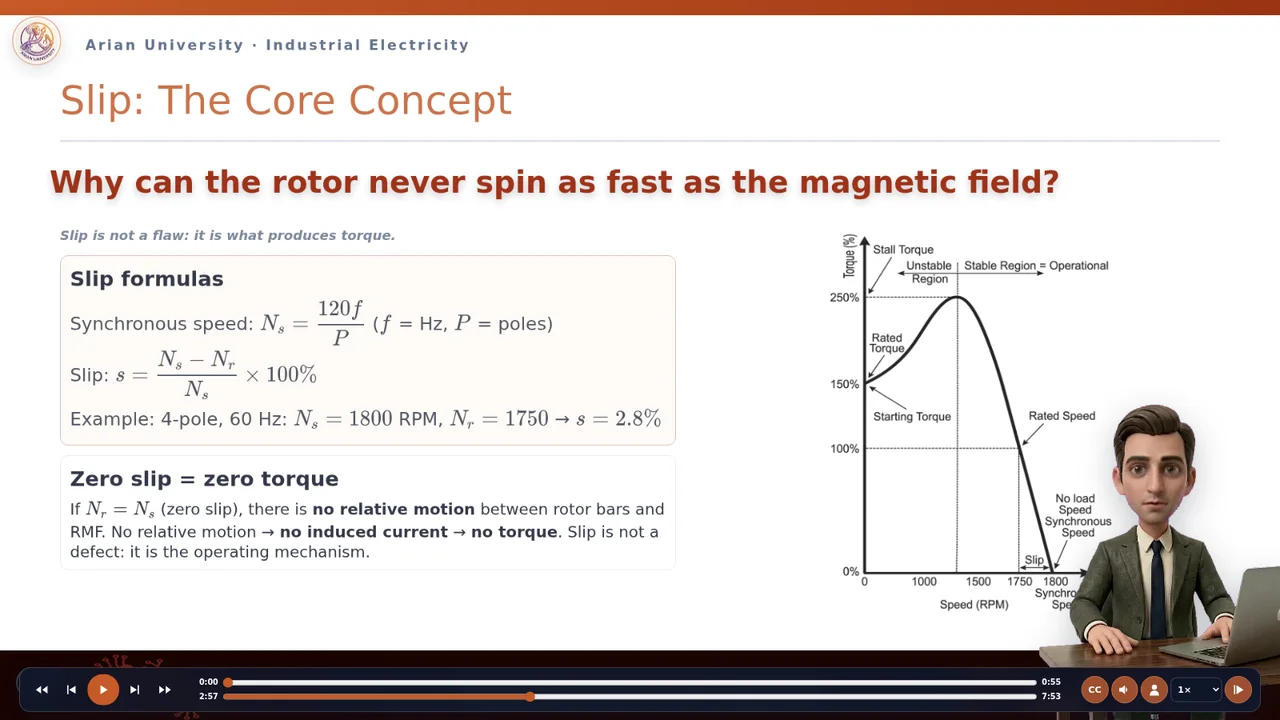
Review the real production evidence, then try the Arian University lesson as an avatar lecture or an interactive note-taking surface.
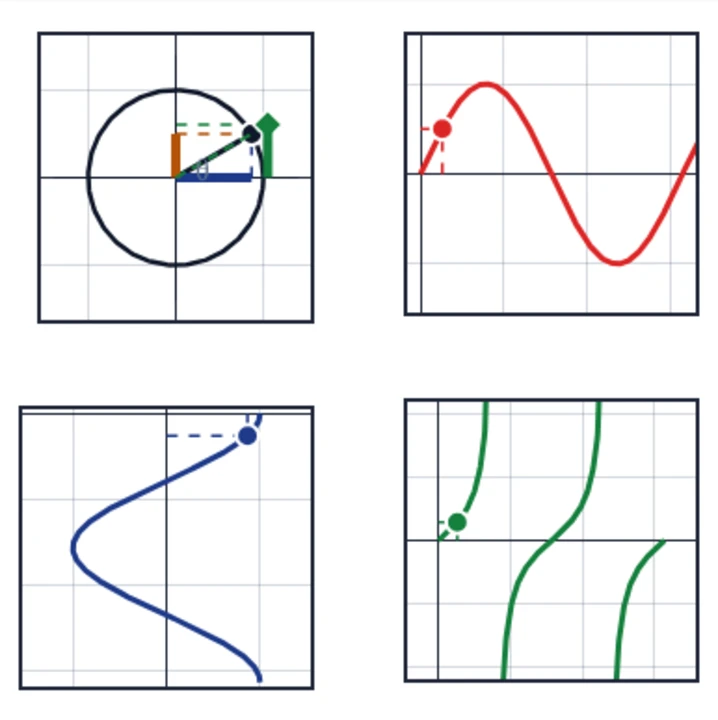
Students see the point on the unit circle, sine, cosine, tangent, and quadrant signs as one connected relationship.
Move the angle slider and observe all four representations update together.
First-party CourseAlive teaching visual, rendered from the native Svelte unit_circle_trig / astc_gallery implementation.
Posters load first for a fast page and a useful print fallback. The trigonometry example can be explored live, while the robotics and anatomy examples are presented as previews during their adoption and review work.
Designed for teaching
The model, controls, and narration remain coordinated as separate layers. This lets one reusable visual support different lessons, teaching approaches, and languages.
A lecture can highlight, focus, animate, pause, and restore the visual at the moment each idea is explained.
Students receive meaningful controls, safe parameter ranges, a reliable reset, and accessible alternatives.
Each visual includes a deliberate poster or print state, concise explanation, attribution, and predictable capture state.
A reusable visual bank
Each lesson selects a shared visual and configures its teaching focus, parameters, and size. Approved improvements to the core component can then benefit every course that uses it.
visualId: visual.math.unit-circle
profileId: linked-representations
displayMode: half-slide
mode: guided
parameters:
  theta: 0.5236
timeline:
  - action: set-angle
  - action: emphasize-tangent
Your course
We can select an existing visual, add one teaching capability when needed, or design a focused new component.